python
Pandas按周/月/年统计数据介绍
发布时间:2022-04-17 发布网站:脚本宝典
脚本宝典收集整理的这篇文章主要介绍了Pandas按周/月/年统计数据介绍,脚本宝典觉得挺不错的,现在分享给大家,也给大家做个参考。
Pandas 按周、月、年、统计数据
介绍
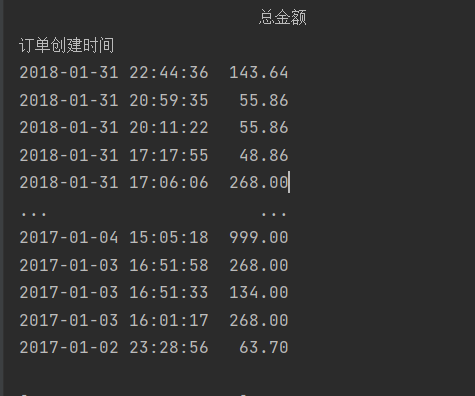
将日期转为时间格式 并设置为索引
import pandas as pd
data=pd.read_excel('5\TB201812.xls',usecols=['订单创建时间','总金额'])
PRint(data)
data['订单创建时间']=pd.to_datetime(data['订单创建时间'])
data=data.set_index('订单创建时间')
print(data)
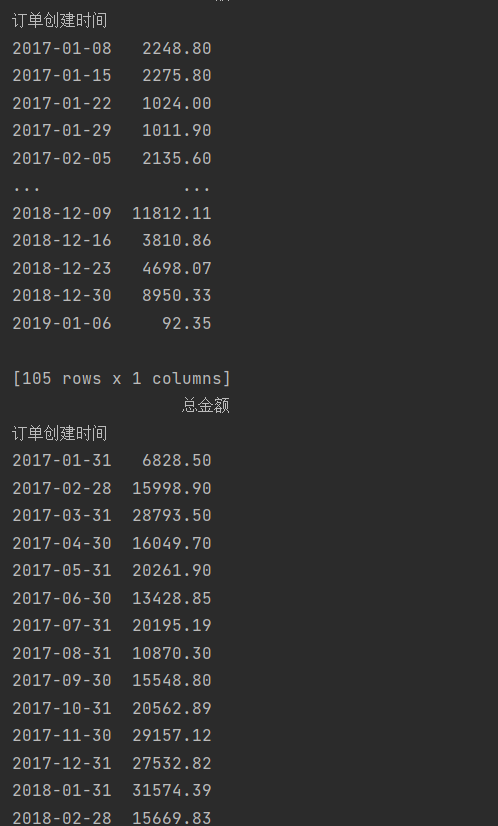
按周、月、季度、年统计数据
import pandas as pd
data=pd.read_excel('5\TB201812.xls',usecols=['订单创建时间','总金额'])
data['订单创建时间']=pd.to_datetime(data['订单创建时间'])
data=data.set_index('订单创建时间')
print(data.resample('w').sum())
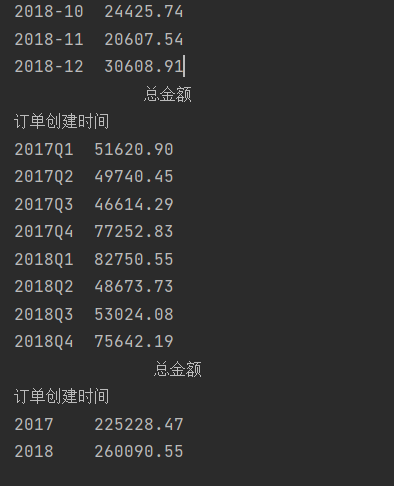
print(data.resample('m').sum())
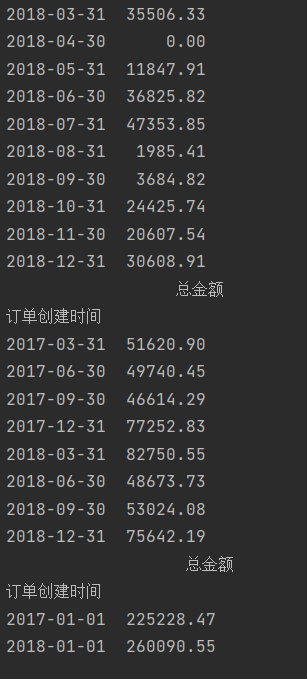
print(data.resample('Q').sum())
print(data.resample('AS').sum())
使用to_PEriod()方法 优化
按月、季度和年显示数据(不统计数据)
import pandas as pd
data=pd.read_excel('5\TB201812.xls',usecols=['订单创建时间','总金额'])
data['订单创建时间']=pd.to_datetime(data['订单创建时间'])
data=data.set_index('订单创建时间')
print(data.resample('w').sum().to_period('w'))
print(data.resample('m').sum().to_period('m'))
print(data.resample('q').sum().to_period('q'))
print(data.resample('as').sum().to_period('a'))
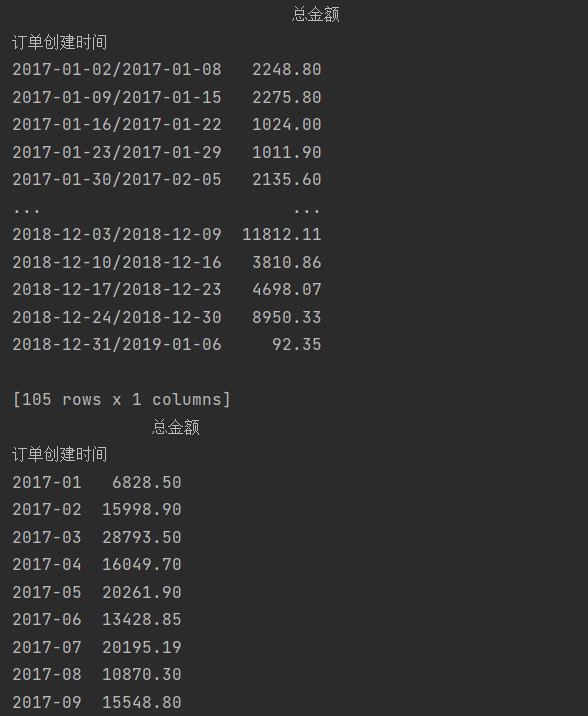
与之前相比 日期的显示方式发生了改变
到此这篇关于Pandas按周/月/年统计数据介绍的文章就介绍到这了,更多相关Pandas统计数据内容请搜索脚本宝典以前的文章或继续浏览下面的相关文章希望大家以后多多支持脚本宝典!
脚本宝典总结
以上是脚本宝典为你收集整理的Pandas按周/月/年统计数据介绍全部内容,希望文章能够帮你解决Pandas按周/月/年统计数据介绍所遇到的问题。
本图文内容来源于网友网络收集整理提供,作为学习参考使用,版权属于原作者。
如您有任何意见或建议可联系处理。小编QQ:384754419,请注明来意。
猜你在找的python相关文章
- python怎么读excel 2022-05-15
- Python Pygame实战之打地鼠小游戏 2022-04-17
- Django admin实现TextField字段changelist页面换行、空格正常显示 2022-04-17
- 基于Python实现的恋爱对话小程序详解 2022-04-17
- 分享6 个值得收藏的 Python 代码 2022-04-17
- python+appium实现自动化测试的示例代码 2022-04-17
- Python实现带GUI界面的手写数字识别 2022-04-17
- Python类的继承与多态详细介绍 2022-04-17
- Python实战之MNIST手写数字识别详解 2022-04-17
- Python实现自动玩贪吃蛇程序 2022-04-17
全站导航更多
html5HTML/XhtmlCSSXML/XSLTDreamweaver教程Frontpage教程心得技巧JavaScriptASP.NETPHP编程正则表达式AJAX相关ASP编程JSP编程编程10000问CSS/HTMLFlexvbsDOS/BAThtahtcpythonperl游戏相关VBA远程脚本ColdFusionMsSqlMysqlmariadboracleDB2mssql2008mssql2005SQLitePostgreSQLMongoDB星外虚拟主机华众虚拟主机Linuxwin服务器FTP服务器DNS服务器Tomcatnginxzabbix云和虚拟化bios系统安装系统系统进程Windows系列LINUXRedHat/CentosUbuntu/DebianFedoraSolaris红旗Linux建站经验微信营销网站优化网站策划网络赚钱网络创业站长故事alexa域名photoshop教程摄影教程Fireworks教程CorelDraw教程Illustrator教程Painter教程Freehand教程IndesignSketch笔记本主板内存CPU存储显卡显示器光存储鼠标键盘平板电脑安全教程杀毒防毒安全设置病毒查杀脚本攻防入侵防御工具使用业界动态Exploit漏洞分析
最新python教程